
Portfolio Bet Select Strategies
Professional-Grade Betting Portfolios. Verified via Live-Fire Market Testing.
Welcome to the Portfolio Bet Select hub—a curated collection of high-performance strategies developed within Hedger Pro.
To ensure the highest standards of transparency and performance, every strategy featured here must undergo a mandatory 60-day live-betting audit. We don't just rely on back tested data; we monitor every selection in real-time to verify liquidity, price stability, and genuine market edge.
Whether a system has officially passed its audit or is currently in the "Live Test" phase, you can track its progress, view the data, and secure your license keys to begin automating these models yourself.
The Unified Portfolio
Author: Ryan Phillips
✅ 60-DAY LIVE AUDIT PASSED - Started 26 December 2025
The Overview:
This portfolio represents the core of our data-led approach, combining four distinct betting models into one balanced stable.
By blending Apex Lays, Prime Backs, Range Layer, and PBR, we achieve a "Unified" equity curve that smoothens out individual market variance. This cluster has been stress-tested for liquidity and execution, proving its edge in the live market.
Unified Portfolio Update: March 19th – March 31st
Overall Portfolio Performance
-
Career Profit: £55,970 (5,597.0 Points)
-
12-Day Movement: +4.00 Points
-
Current 30-Day Trend: -5.00 Points
-
Career Yield: 17.43%
-
Career A/E: 109.96
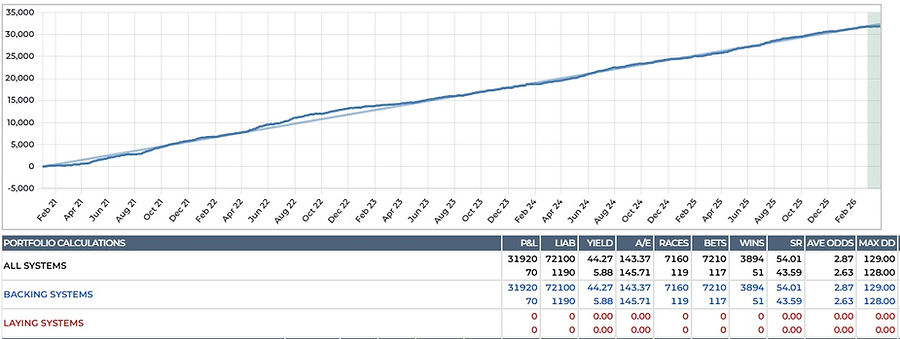
Backing Systems Sector
-
Career Profit: £31,920 (3,192.0 Points)
-
12-Day Movement: 0.00 Points
-
Current 30-Day Trend: +7.00 Points
-
Sector Yield: 44.27%
-
Sector A/E: 143.37
Laying Systems Sector
-
Career Profit: £24,050 (2,405.0 Points)
-
12-Day Movement: +4.00 Points
-
Current 30-Day Trend: -12.00 Points
-
Sector Yield: 9.66%
-
Sector A/E: 106.78
The Unified Portfolio remains in a steady consolidation phase. While the "Past 30 Days" row shows a minor dip of 5 points, the long-term equity curve remains incredibly linear.
The highlight of this update is the Laying Systems sector, which successfully navigated the last 12 days to post a 4-point gain, despite a slightly higher liability load during the period. The Backing Systems held perfectly firm at 0.00 movement, which, during a high-volume period (over 7,000 career bets), is a testament to the structural stability of the filters.
With a combined career A/E nearing 110.00 across 40,000 bets, the portfolio continues to prove that its "Value Gap" is permanent rather than a result of short-term variance.

Individual Strategy Deep-Dives
PB Prime Back "The Growth Accelerator"
The primary value-acquisition model of the portfolio. Unlike standard backing systems, Prime Back utilizes a proprietary filtering logic to maintain a robust strike rate while capturing significant market value. It acts as the "growth engine" of the cluster, designed to capitalize on market inefficiencies and aggressively build the bankroll.
Select Strategy Update:
12-Day Performance (Mar 19th – Mar 31st)
-
Net Movement: 0.00 Points (£0)
-
Current 30-Day Trend: +7.00 Points (£70)
Overall Career Benchmarks
-
Total Profit: £31,920 (3,192.0 Points)
-
Career Yield: 44.27%
-
Career A/E Ratio: 143.37
-
Strike Rate: 54.01%
-
Average Winning Odds: 2.87
Prime Back continues to be the bedrock of the Select portfolio. During this 12-day window, the system held its ground with zero net movement—a highly positive sign of stability for a strategy that has already processed over 7,200 bets.
The core strength of this system is its efficiency; maintaining a 44% yield and an A/E of 143.37 over such a massive sample size is statistically rare. It provides the high-frequency winning sequences (54% strike rate) required to anchor a professional betting bankroll.
Portfolio Bet Ranked (PBR) "The High-Certainty Stabilizer"
PBR is engineered to provide the portfolio's steady baseline. It is specifically designed to minimize drawdowns and protect the bankroll through sheer statistical frequency.
Select Strategy Update:
12-Day Performance (Mar 19th – Mar 31st)
-
Net Movement: +1.00 Point (£10)
-
Current 30-Day Trend: -7.00 Points (-£70)
Overall Career Benchmarks
-
Total Profit: £10,720 (1,072.0 Points)
-
Career Yield: 8.37%
-
Career A/E Ratio: 107.92
-
Strike Rate: 92.29%
-
Average Odds: 7.49
PBR continues to perform its role as the "Reverse" stabilizer of the portfolio. While the wider 30-day window showed some minor variance (-7 points), the final 12 days of March saw the system return to profitability with a 1-point gain.
With over 13,000 bets processed, the statistical significance of this model is immense. Maintaining a strike rate above 92% with an A/E of 107.92 ensures that the bankroll remains protected even during volatile market periods.

PB Range Layer "The High-Probability Anchor"
Range Layer analyzes specific price brackets where market over-valuation is most prevalent. It serves as the portfolio’s "safety net," delivering relentless, small-margin gains with exceptionally low volatility. It is the perfect model for those who prioritize capital preservation alongside steady growth.
Select Strategy Update:
12-Day Performance (Mar 19th – Mar 31st)
-
Net Movement: +7.00 Points (£70)
-
Current 30-Day Trend: +3.00 Points (£30)
-
Overall Career Benchmarks
-
Total Profit: £7,890 (789.0 Points)
-
Career Yield: 9.07%
-
Career A/E Ratio: 104.69
-
Strike Rate: 96.97%
-
Average Odds: 14.57
PB Range Layer continues to be a standout performer in the "low-volatility" category. While the mid-month period saw some minor consolidation, the final 12 days of March were exceptional, with the system finding 7 points of profit to push its career total to nearly £8,000.
Maintaining a 9.07% yield over 16,000+ bets is a significant achievement for a laying model, and the career A/E of 104.69 confirms that the system is consistently identifying runners that are over-bet by the general market.

Apex Lays "The Portfolio Engine Room"
By focusing on horses with a specific profile of market weakness at low odds, Apex Lays keeps the equity curve moving upward even during periods of natural variance in other systems. Its low-liability profile makes it an essential component for bankroll protection.
Select Strategy Update:
12-Day Performance (Mar 19th – Mar 31st)
-
Net Movement: -4.00 Points (-£40)
-
Current 30-Day Trend: -8.00 Points (-£80)
-
Overall Career Benchmarks
-
Total Profit: £5,440 (544.0 Points)
-
Career Yield: 16.01%
-
Career A/E Ratio: 116.04
-
Strike Rate: 75.11%
-
Average Odds: 2.90
Apex Lays encountered a period of minor resistance in late March, closing the final 12 days with a 4-point dip. In the context of a laying system targeting shorter-priced runners (average odds of 2.90), these pockets of variance are a standard part of the long-term cycle.
Crucially, the system’s core metrics remain exceptionally high. Maintaining a career yield of 16% and an A/E of 116.04 after more than 3,100 bets places this strategy in the top tier of performance models. The equity curve continues to show a strong upward trajectory, despite this month's minor consolidation.

The Live Performance Walkthrough
+£1,558.91 Profit (Dec 26th – Feb 21st)
Video Duration: 42 Minutes
Stakes Used: £10 Flat Stake
In this comprehensive deep-dive, I pull back the curtain on the new Portfolio Bet systems. This isn’t a highlight reel; it is a transparent look at the actual betting experience over the last two months of live action.
What this video covers:
-
Live Betting Demonstration: A walkthrough of the ‘Bet’ tab in Hedger Pro, showing the unified results and equity curve from the December 26th launch.
-
The £1,558.91 Proof: Verification of the recent performance using a standard £10 flat stake.
-
Strategy-by-Strategy Breakdown: I explain the specific logic behind each of the four new systems and how they interact to protect the bank.
-
A Week in the Life: Day-to-day footage of the race cards, demonstrating exactly what it looks like to manage these bets across a full betting week.
-
Evolution of the Logic: Why these new versions were created and how they have been refined to handle current market conditions.
-
Getting Started: Where to begin and what is required.
The "NJ-5" High-Growth Portfolio
Author: Niko Jr.
Status: 🔄 IN LIVE PROOFING (Active Trial) Started 19/3/2026
Published 12 Days Live Betting
The Overview:
The NJ-5 is a "Big Data" backing portfolio designed for aggressive bankroll growth.
Comprised of five distinct backing systems, this cluster targets high-value opportunities at an average price of 39.20.
This is a high-turnover, high-reward approach—delivering over £231,720.00 in total profit since 2021.
Key Performance Metrics (Jan 1st 2021 – March 19th 2026):
Based on a £10 flat stake
Betting using Betfair Starting Price (BSP).
-
Total Profit: £231,720.00
-
Portfolio Yield: 79.63%
-
Total Bets: 29,099
-
A/E Ratio: 135.84
-
Last 12 Months Profit: £15,030.00
-
Max Drawdown: £1,638.00

NJ System 1 (Backing)
This strategy utilizes a complex, multi-layered filtering process to identify value across UK and Irish horse racing. Unlike simpler models, System 1 cross-references a wide array of course-specific variables to find its edge.
Select Strategy Update:
12-Day Performance (Mar 19th – Mar 31st)
-
Net Movement: -11.00 Points (-£110)
-
Career P&L: £16,400 (1,640.0 Points)
-
12-Month Performance (Selected Row)
-
12-Month P&L: +£320 (+32.0 Points)
-
12-Month Yield: 2.78%
-
12-Month A/E: 104.41
-
Total Bets (Year): 1,148
-
Average Odds: 9.58
NK-1 illustrates the "patience pays" nature of high-odds backing. While we saw an 11-point correction in the final 12 days of March, the 12-month view remains firmly in the black with a 32-point profit.
For a system averaging nearly 10/1 (9.58), the 12-month A/E of 104.41 shows that even during quieter spells, Niko is still consistently beating the market's expected probability. This is a "volume and value" play—it’s designed to weather short-term variance like we saw this week to capture the big priced winners that drive that massive £16,400 career profit.

NJ System 2 (Backing)
System 2 is the "sniper" of the NJ Portfolio, utilizing a narrower cross-section of advanced filters to identify high-probability value. This system prioritizes quality over quantity, resulting in a significantly higher yield than high-frequency models.
Select Strategy Update:
12-Day Performance (Mar 19th – Mar 31st)
-
Net Movement: -1.00 Point (-£10)
-
Career P&L: £15,240 (1,524.0 Points)
12-Month Performance (Selected Row)
-
12-Month P&L: +£2,730 (+273.0 Points)
-
12-Month Yield: 68.77%
-
12-Month A/E: 128.00
-
Total Bets (Year): 397
-
Average Odds: 15.47
NK-2 is a high-conviction backing strategy. While the final 12 days of March were effectively a "breather" (-1 point), the 12-month metrics are nothing short of elite.
Maintaining a 68.77% yield over a full year with average odds of 15.47 is phenomenal. Most systems at this price range suffer from wild swings, but NK-2 has delivered 273 points of profit in the last 12 months with a very respectable 16% strike rate. For subscribers, this remains one of the most explosive yet mathematically sound strategies in the Niko Jr. arsenal.

NJ System 3 (Backing)
System 3 is engineered to identify extreme value at the top end of the market, specifically targeting runners at massive Betfair Starting Prices. While it requires a patient approach, it is the primary driver of the portfolio’s explosive profit growth.
Select Strategy Update:
12-Day Performance (Mar 19th – Mar 31st)
-
Net Movement: -3.00 Points (-£30)
-
Career P&L: £97,600 (9,760.0 Points)
12-Month Performance (Selected Row)
-
12-Month P&L: +£1,720 (+172.0 Points)
-
12-Month Yield: 32.45%
-
12-Month A/E: 137.50
-
Total Bets (Year): 530
-
Average Odds (Year): 97.31
NK-3 is the portfolio’s high-altitude explorer. With an average price of 97/1 over the last 12 months, this system isn't about daily wins; it's about the massive "value strikes" that redefine a bankroll.
Despite a small 3-point dip at the end of March, the 12-month performance is stellar, boasting a 32.45% yield and an A/E of 137.50. To see a strategy near its career peak of £97,600 while hunting at these odds is a testament to the accuracy of the underlying model. It remains a core "lottery-beater" for the Select portfolio.

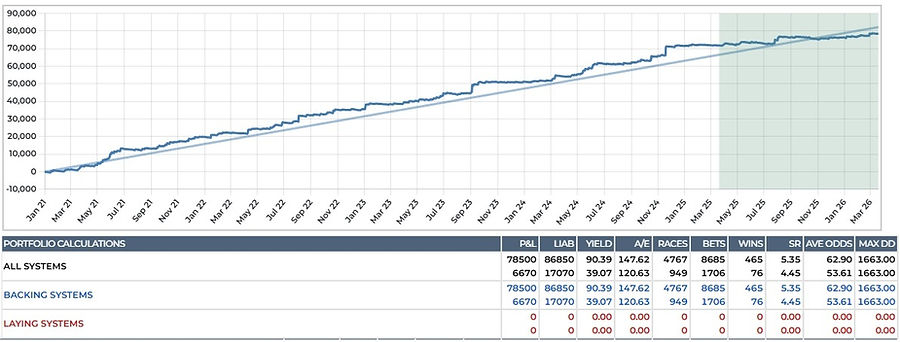
NJ System 4 (Backing)
System 4 is designed to capture runners that the market has fundamentally mispriced in the double-digit range. It serves as a high-growth engine within the NJ Portfolio, providing significant profit spikes through consistent long-shot strikes.
Select Strategy Update:
12-Day Performance (Mar 19th – Mar 31st)
-
Net Movement: -19.00 Points (-£190)
-
Career P&L: £78,310 (7,831.0 Points)
-
12-Month Performance (Selected Row)
-
12-Month P&L: +£5,810 (+581.0 Points)
-
12-Month Yield: 34.36%
-
12-Month A/E: 116.13
-
Total Bets (Year): 1,684
-
Average Odds (Year): 53.82
NK-4 provides a perfect lesson in perspective. At first glance, a 19-point dip over 12 days might look sharp, but when placed against the 12-month profit of 581 points, it is merely a minor ripple.
When you are backing horses at an average price of 53/1, variance is the price of admission. The fact that the system maintains a career yield of nearly 90% and a long-term A/E of 147.62 proves that the underlying logic is capturing a massive edge. The takeaway is clear: this is a long-term profit engine that requires a sturdy stomach for the short-term swings.
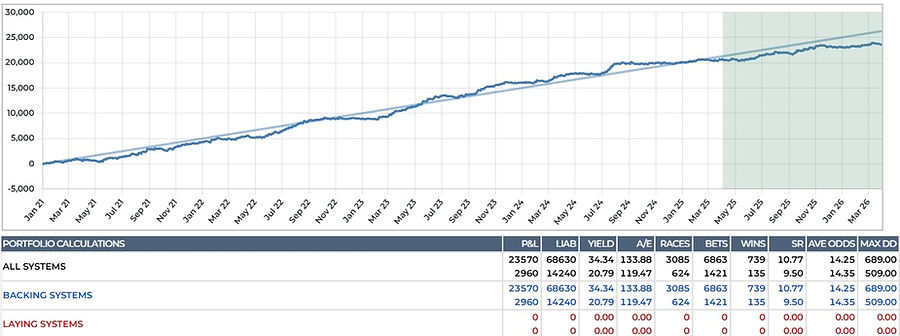
NJ System 5 (Backing)
Select Strategy Update:
12-Day Performance (Mar 19th – Mar 31st)
-
Net Movement: -26.00 Points (-£260)
-
Career P&L: £23,570 (2,357.0 Points)
12-Month Performance (Selected Row)
-
12-Month P&L: +£2,960 (+296.0 Points)
-
12-Month Yield: 20.79%
-
12-Month A/E: 119.47
NK-5 felt the sting of variance in the final stretch of March, giving back 26 points.
However, this highlights exactly why we look at the 12-month trend. Despite a sharp 12-day dip, the system remains up nearly 300 points for the year with a superb 20% yield. For a high-odds backing strategy, these 20-30 point "breathers" are the standard cost of capturing the much larger upward surges.
Ready to Automate Your Edge?
Join Portfolio Bet today and gain instant access to our Verified and In-Test portfolios.
Whether you want the established stability of our Verified Foundational Four or the high-growth potential of the NJ-5 Proofing Lab, all paths lead to the same destination: professional, data-driven automation.
Remember, you can test the free portfolios completely risk-free by using the Hedger Pro 7-Day Free Trial.
Download the software, import your chosen strategy keys, and see the live-market performance for yourself before committing.